Audio pipeline performance testing
The host benchmark exercises Echidna's public DSP C API and the real native PCM conversion bridge. It implements the latency, instrumentation, stress, and DSP checks required by Sections 5, 9, and 11 of the specification and the effect checks in Section 20.
Host results measure processing cost only. They are not Android callback latency, Audio HAL latency,
acoustic latency, or end-to-end call latency. Those claims still require release builds on target
devices and the device matrix described in spec.md.
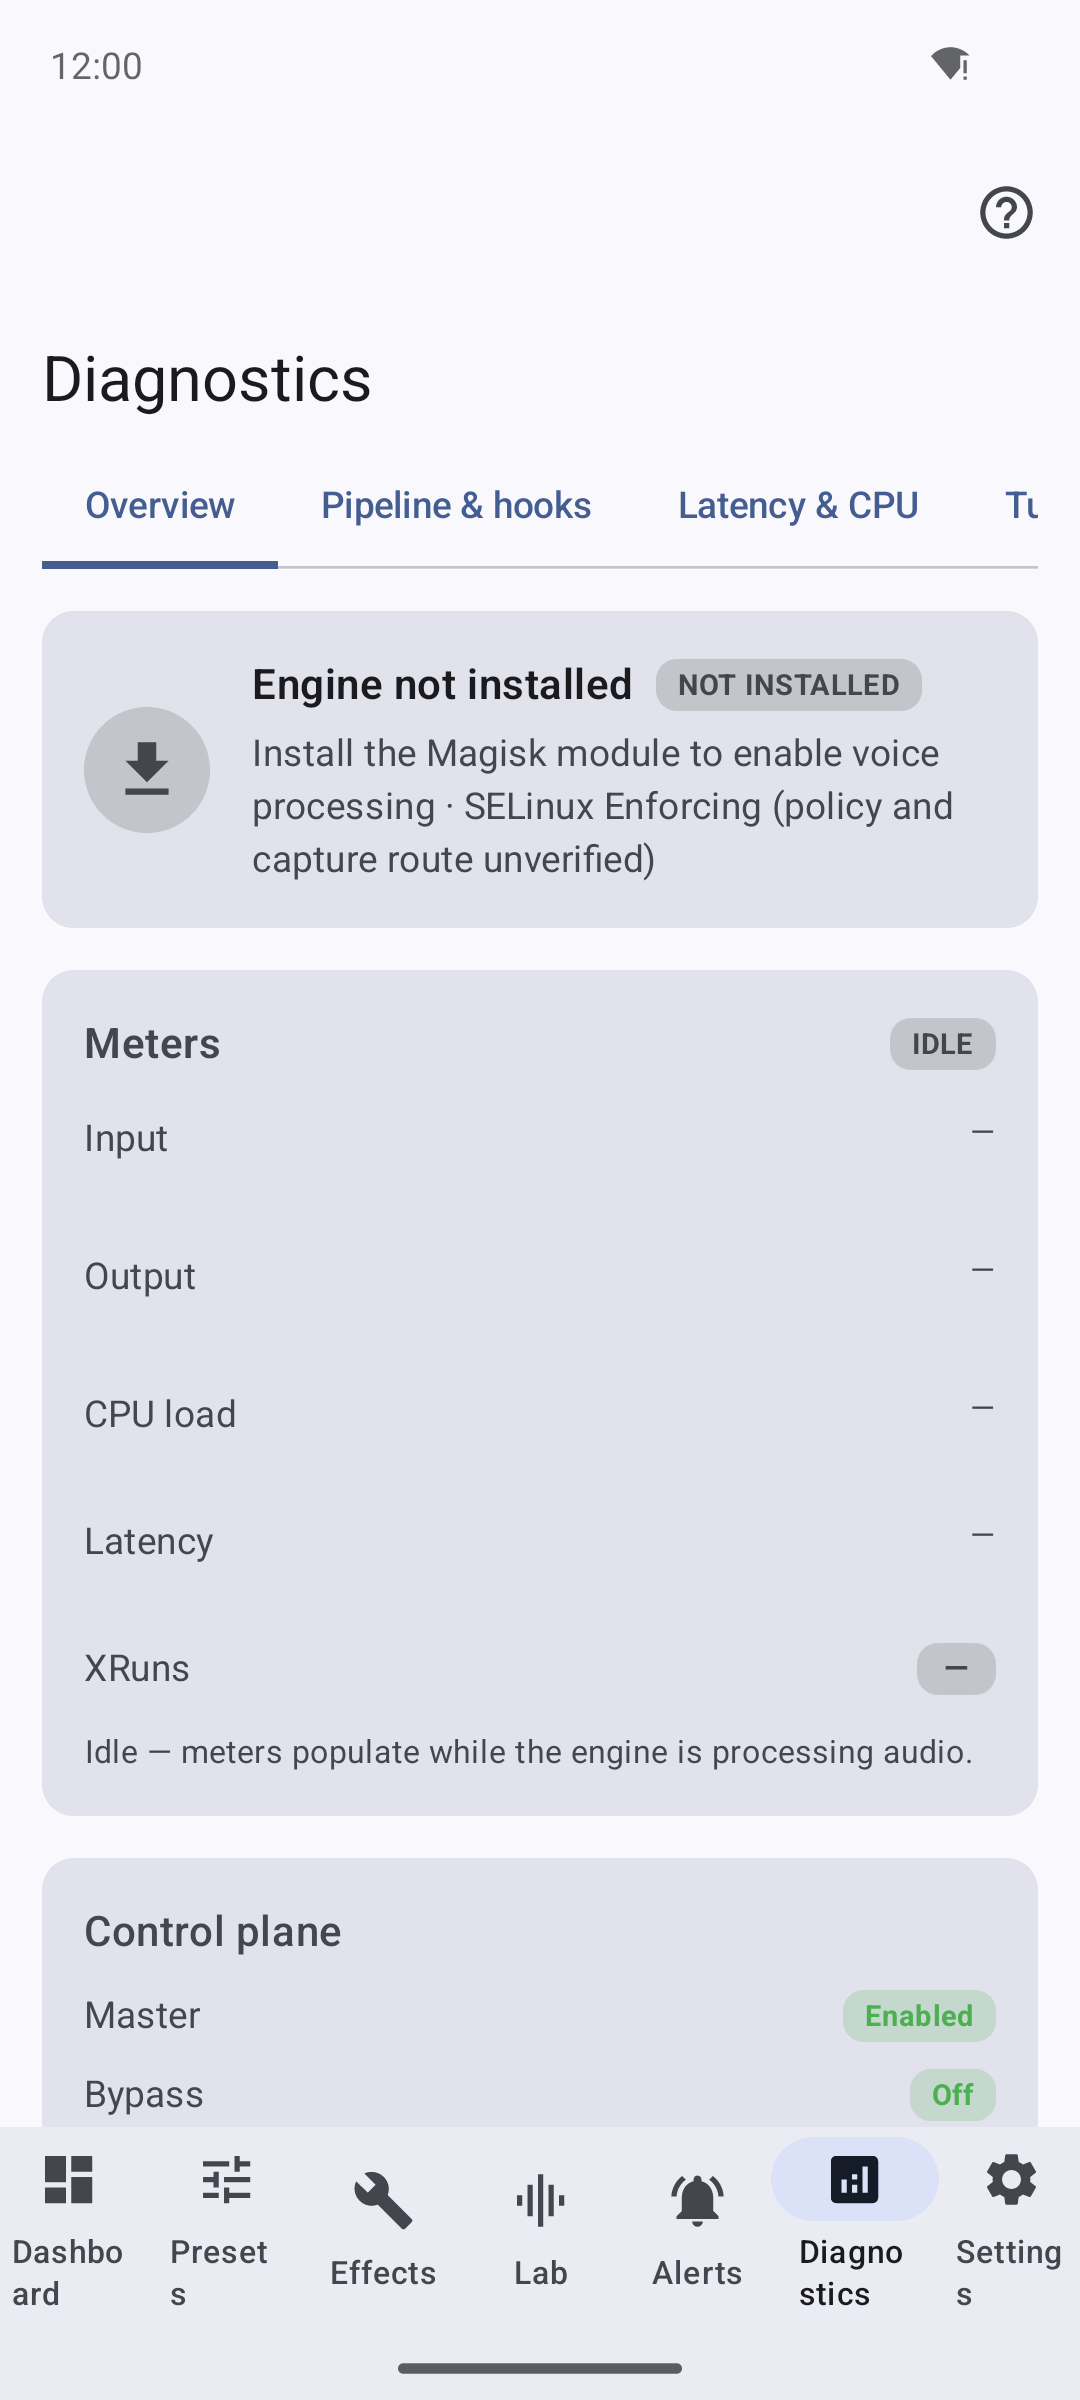
On the device side, the in-app Diagnostics screen surfaces runtime telemetry — average processing latency and XRun counts from the native watchdog. On an unrooted emulator it honestly reports Engine Not Installed with empty telemetry; the host benchmark on this page is a separate, device-independent measurement of DSP cost.
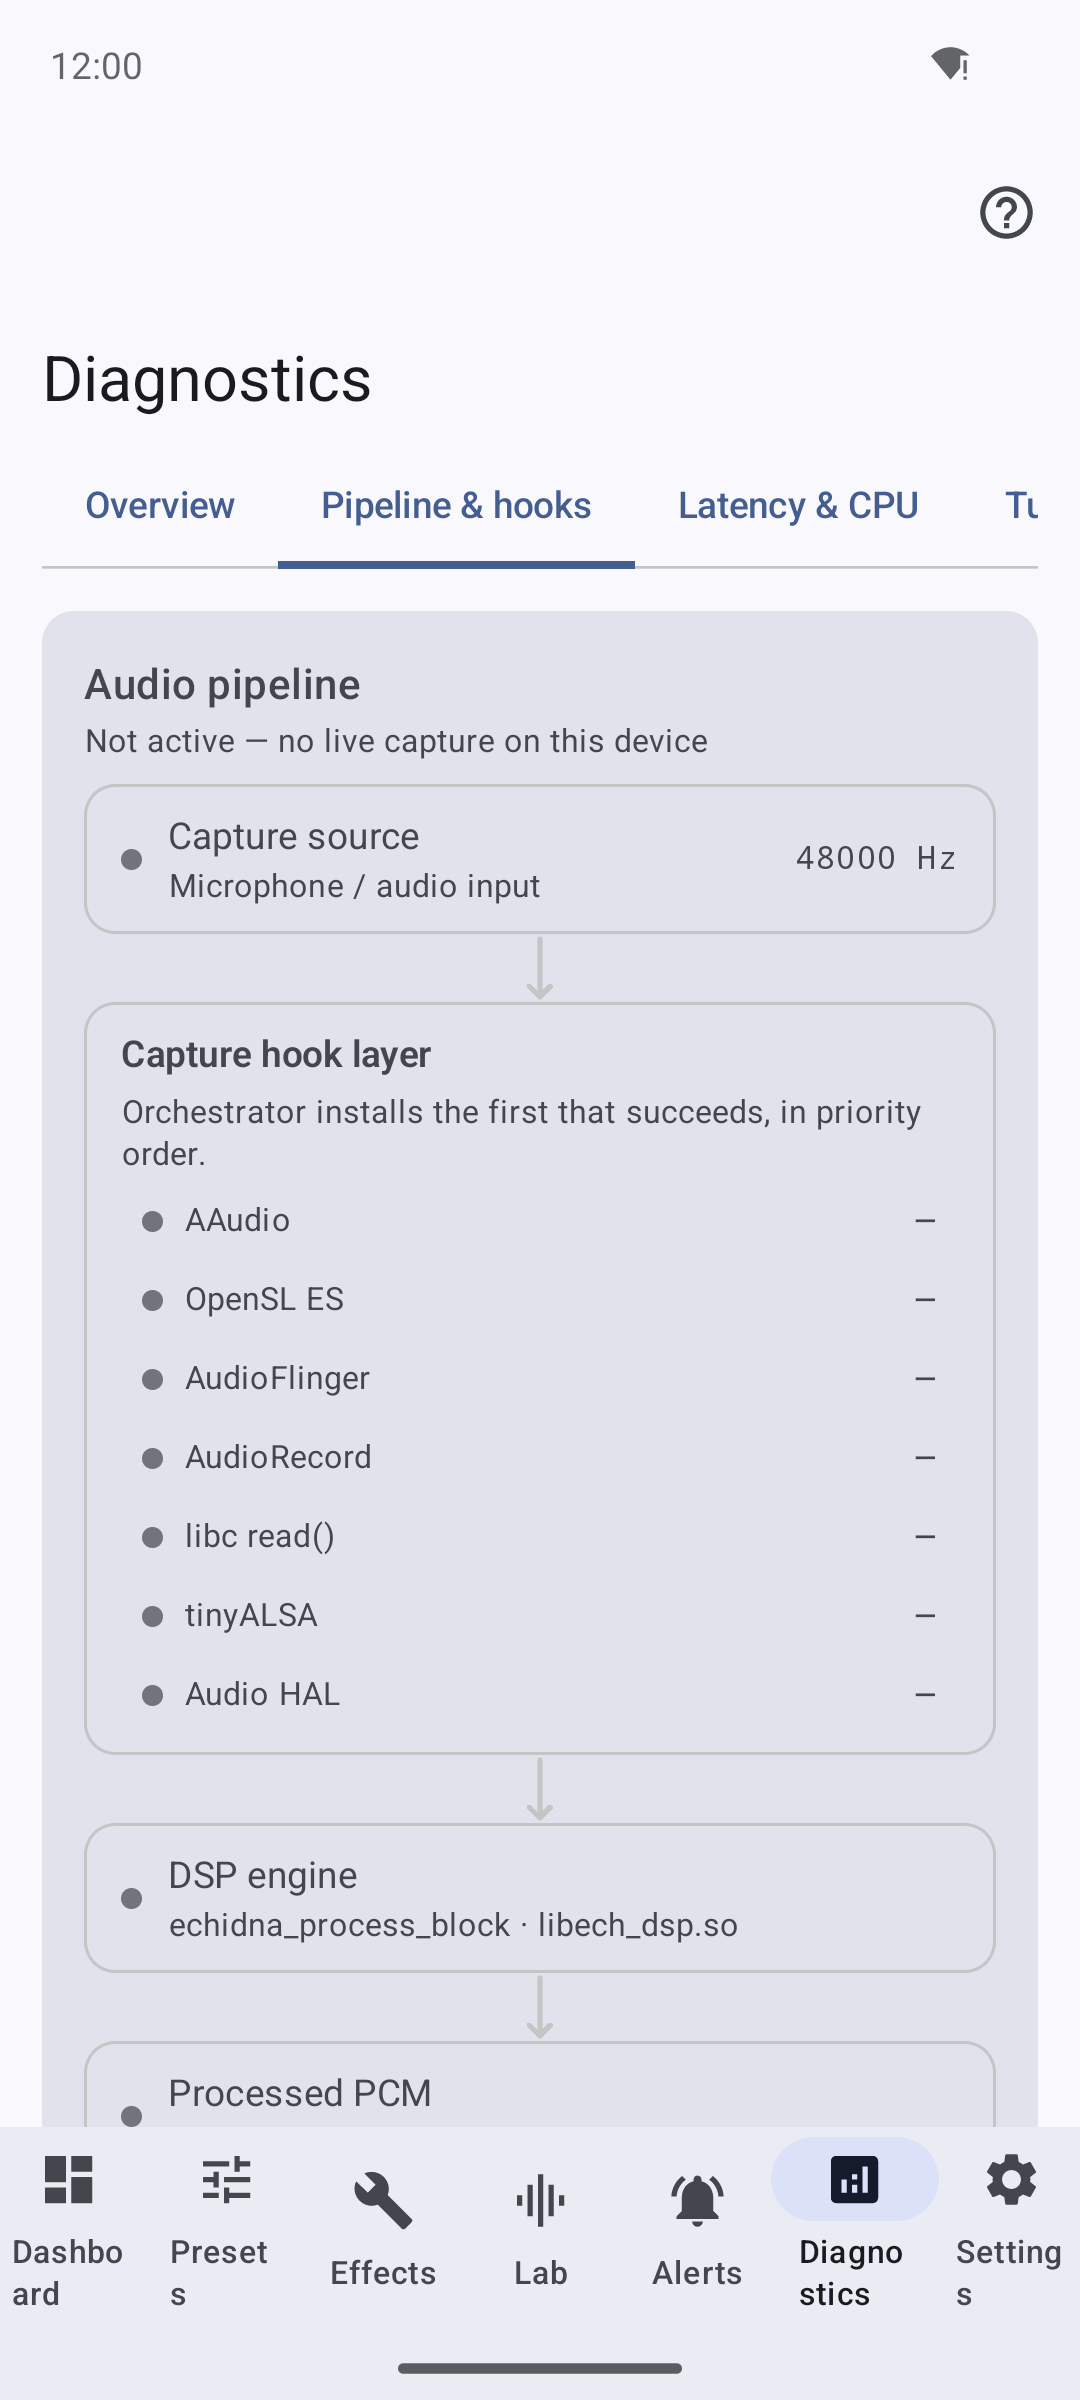
Diagnostics also draws the audio-pipeline graph (HAL → DSP engine → processed PCM → consumer). On this unrooted device no signal flows because the engine is not hooking audio; on a rooted device with Zygisk the winning hook animates.
Two different measurements
The host benchmark here measures DSP processing cost on your build machine. The app's Diagnostics telemetry measures on-device runtime behaviour once an engine is installed and running. Do not read one as proof of the other — see Verification for the device-gated boundary.
Run the benchmark
Use a release-optimized build. The wrappers configure the standalone tools/perf/CMakeLists.txt,
which builds the production libech_dsp sources and the production PCM buffer processor.
powershell
tools/perf/run_audio_pipeline_benchmark.ps1
sh
bash tools/perf/run_audio_pipeline_benchmark.sh
The default full run uses 200 warmups and 1,200 measured calls per scenario. It runs each scenario without background load and with one deterministic CPU load worker. Use the quick matrix while developing:
powershell
tools/perf/run_audio_pipeline_benchmark.ps1 -Quick -Warmups 50 -Iterations 300
The scripts write audio_pipeline_results.json and audio_pipeline_results.md below
build/audio-perf/results/. Build outputs and machine-specific measurements are intentionally not
versioned. The stable JSON contract is tools/perf/audio_pipeline_result.schema.json. Both wrappers
run the standard-library-only validate_audio_pipeline_report.py contract checker after report
emission; Python 3.10 or newer is required.
The compact post-handoff comparison is tracked as
tools/perf/audio_pipeline_post_handoff_comparison.json. It records report hashes, the exact host
and methodology, a canonical-LF bundle hash of the production DSP and PCM bridge sources, grouped
latency/deadline/throughput results, functional audio metrics, and the predeclared
material-regression policy without committing the large raw reports. Verify that the evidence still
matches the benchmark, report schema, and production processing sources with:
powershell
python tools/perf/compare_audio_pipeline_reports.py verify `
  tools/perf/audio_pipeline_post_handoff_comparison.json
The compact artifact explicitly records that its historical raw baseline is ignored rather than tracked. Its hash makes the local source report identifiable, but it is not a substitute for retaining raw CI artifacts or release-device measurements. Non-audio contract metrics, such as an intentional public API version advance, require baseline/current values, the source-declared current version, and an allowlisted rationale plus change reference; audio metrics remain exact to the declared tolerance.
Coverage
The broad performance matrix compares:
- a raw
memcpybypass baseline; - the public DSP path with a loaded neutral preset;
- a representative low-latency gate, EQ, compressor, pitch, formant, reverb, and mix chain;
- a focused high-quality pitch and Auto-Tune chain;
- interleaved float processing and the actual PCM16 decode, DSP, finite check, saturation, and encode bridge;
- 16, 44.1, 48, and 96 kHz; mono and stereo; and 64, 128, 240, 256, 480, and 960-frame blocks.
Functional checks use deterministic sine sweeps, multi-tone signals, impulses, seeded noise, silence, and amplitude steps. The report records RMS, peak, mean absolute delta, correlation, SNR, Goertzel band gain, both pitch-shift directions, compressor dynamic-range reduction, gate attenuation, reverb tail energy, stereo isolation, finite output, and buffer sentinels. Auto-Tune convergence runs as continuous four-second-or-longer streams across 44.1, 48, and 96 kHz; 128, 480, and 2,048-frame callbacks; and corrections both up and down toward A4. Neutral float output must be transparent; neutral PCM16 output must stay within its quantization tolerance; amplified PCM16 must saturate at both integer rails.
The current engine has no limiter or spatial stage. The result inventory records those gaps rather than claiming coverage for effects that do not exist.
Timing and regression policy
All allocations, preset updates, engine initialization, realtime preparation, and PCM input
restoration occur outside the timed region. Every path executes the same compiler-only output-memory
barrier immediately before the end timestamp. An output-dependent checksum is calculated after the
timestamp, accumulated in scenario-local state, and published only after background workers stop;
this prevents call or memcpy elimination without timing atomic or checksum work. Background-load
workers keep cache-line-isolated local sinks and publish no shared state while measurements run.
Each DSP scenario uses the public initialize -> update_config -> prepare_realtime -> process_block
lifecycle.
Per-buffer samples use std::chrono::steady_clock. Percentiles use the nearest-rank definition
ceil(p * n) with no interpolation. The JSON records the compiler, release flags, CPU, OS, clock
tick, warmup count, measured sample count, fixed scenario seed, and background-load count.
Every scenario reports mean, p50, p95, p99, maximum, per-frame cost, frames per second, real-time factor, and p95/p99 ratios against the matching bypass and neutral cases. Loaded scenarios also report p95/p99 ratios against the matching unloaded result.
Choose the contention level explicitly when comparing machines or revisions. For example,
-LoadThreads 8 (PowerShell) or ECHIDNA_PERF_LOAD_THREADS=8 (shell) records both an unloaded
baseline and the same matrix under eight deterministic CPU workers. The workers start before that
scenario's warmups, so loaded warmups and measurements see the same contention policy. Run the
unloaded baseline while unrelated builds and tests are idle; otherwise scheduler noise can dominate
sub-microsecond cases.
The strict outcome is p99 <= buffer duration; it remains visible even when it misses. To avoid a
flaky host gate, only an unloaded p99 above max(30 ms, 4 * buffer duration) fails the performance
regression run. Background-load results are informative and non-gating. Functional DSP activation,
API/config status, finite output, and sentinel checks are hard failures.
Interpreting failures
An enabled effect must produce its expected directional change, not merely nonzero output. For stateful effects, the harness supplies the documented warmup or tail interval before evaluating the steady state. A failure should include the exact preset, sample rate, channel layout, callback size, fixture, and numeric result when assigned to the owning DSP or HAL lane.
Do not raise host timing thresholds to hide a functional failure or a release-device regression. Capture a new versioned baseline only when the environment and rationale are documented and the audio correctness checks remain green.